Communicating information to a global audience is never easy owing to the lack of a common language understood by everyone around the world. That is where visual design comes in. With no language barriers, and its ability to engage a global audience, visual design is one of the most effective and impactful means of communication. The power of visual communication is evident from the fact that we remember pictures longer and more easily than words. Moreover, we can process pictures much more quickly than words.
In think tanks, visual communication happens at multiple levels and in various forms, for example, process diagrams, graphs, progress reports, and infographics. However, researchers face several challenges in incorporating such visual elements in their documents. For example, the researcher might find it difficult to strike a balance between text and visual content; the process might be time consuming because it has to be outsourced; the researcher might not be convinced of the design. Moreover, a researcher might find it challenging to decide which part of the document requires
visual aid, as not everything can be represented graphically.
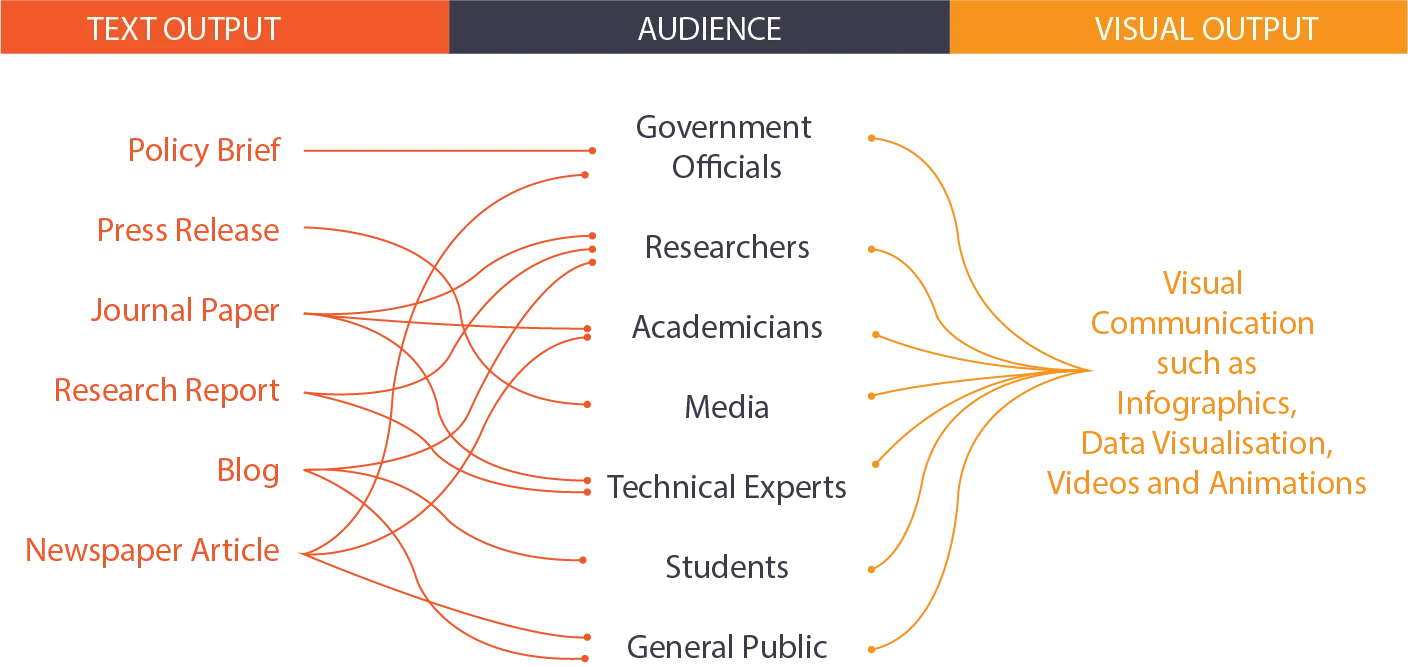
A single study may need different outputs for different audiences and stakeholders. For instance, policy briefs are intended for government officials, research papers are read by the scientific community, and blogs and newspaper articles are published for the general public. Notwithstanding these differences, visual outputs engage readers much more effectively than text, and can help achieve the intended objective.
In the COVID-19 scenario, everyone is forced to work from home to maintain social distancing. Physical meetings have been replaced by virtual ones on tools such as Microsoft Teams, while communication happens via emails and calls. While this situation may sound like a challenge, it presents an opportunity too — one that can be leveraged by upgrading communication strategies and including visual design in communication outputs.
There are multiple ways to present information and several tools available that can help build information design. One of the best tools, and also the simplest, is Microsoft PowerPoint, which provides many types of graphs and charts. Moving up a level, you have Adobe’s suite of high-performance, complex tools such as Illustrator, InDesign, Photoshop, and Aftereffects. One must have a design background to adequately work with these tools; in fact, first-time users will find it quite difficult to manage them. Graphic or communication designers can use these tools to build original, customised, and relevant solutions. However, not every team can have a dedicated designer, and someone with a non-design background has to do the work
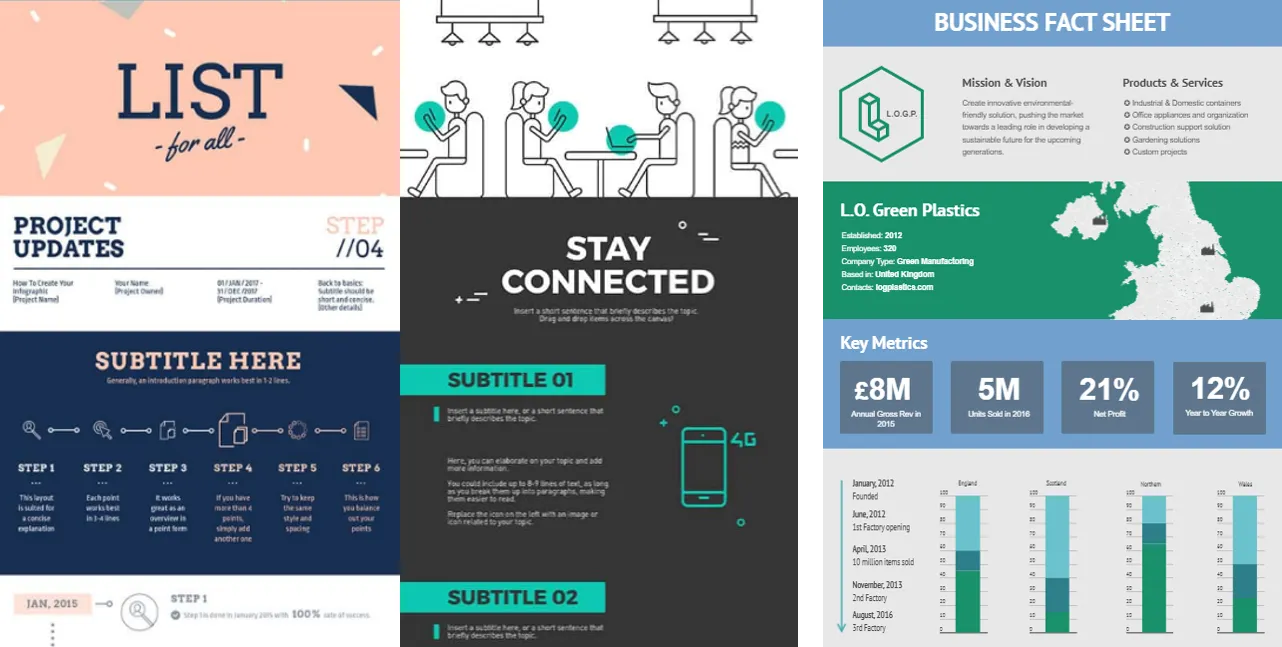
There are online tools such as Adobe Spark, Infogram, Piktochart, Visual.ly, and Canva
that are either free to use or offer nominally priced subscription plans. These tools can
help create visual elements such as infographics, posters, charts, diagrams, and social
media posts that can easily be embedded in reports, papers, blogs, etc. In addition,
most websites provide templates that help save time and energy to a large extent.
Another smart way to make content interesting is to combine text with supporting icons. Many icons are available and can be downloaded for free from online libraries such as Flaticon, Iconfinder, and iconmonstr. Below is an example showing different icon styles for the same content.

Users can also create their own icons to represent specific words/content by using Microsoft PowerPoint or Gimp. Visual content can be created, customised, or bought, depending on the researcher’s ease in using the design software. Visual design, thus, helps create more effective and impactful content. The impact can be validated through responses and feedback from the target audience. This will also help in continuously improving visual designs and bringing in more creativity in communication outputs.
The author is Visual Communications Officer at CSTEP


Just over a year ago, an artificial intelligence (AI)-generated recreation of Sir...
With India’s Carbon Credit Trading Scheme (CCTS) expected to become fully operational...
Recent tensions around the Strait of Hormuz and the ongoing effects of...

From 1 April 2026, the Solid Waste Management (SWM) Rules, 2026, will...

In our ‘Thinking in Models’ series, we draw on insights from NITI...