In our previous blog in the Measuring the Microns series, we briefly described the importance of targeting fine particulate matter (PM2.5) and the role of real-time source apportionment in tracking it. In this blog, we turn to PM1, discuss the role of simultaneous, real-time tracking of multiple PM fractions, and present insights regarding PM1 sources from a Bengaluru- and Kolkata-based case study.
Submicron PM (PM1)—a sub-component of PM2.5—comprises particles smaller than one micron. Due to their smaller size, PM1 has a greater surface-area-to-volume ratio than larger particles, enabling them to reach even the deeper parts of the lungs and, in some cases, enter the bloodstream. Evidence increasingly suggests that PM1 is associated with more adverse health effects than the larger particles within PM10. Further, PM1 may carry more toxins (e.g., metals and organic compounds) than larger particles, triggering inflammation and epigenetic changes. As per a study, a 10 µg/m3 increase in PM1 is associated with 21% and 38% higher cardiovascular disease rates than those for PM2.5 and PM10, respectively. Higher PM1/PM2.5 ratios (0.80–0.96) are found to be linked with more cases of high blood pressure and hypertension, calling for effective mitigation strategies against these particles.
To aid the development of mitigation strategies, India has considerably expanded the existing network of PM2.5 monitoring within the last decade by utilising both reference-grade monitors and low-cost sensors. However, current monitoring networks do not provide size-resolved information on the submicron (PM₁) and larger fine (PM₁–₂.₅) fractions, which differ in particle number concentrations, sources, and associated health risks. Thus, there is a need to build on the success of PM2.5 monitoring and incorporate the submicron fraction or PM1 into the next phase of air quality monitoring in India.
Size-resolved PM measurements or simultaneous measurement of different PM fractions can provide information about the nature of polluting sources or identify the dominant sources during a particular season or period of interest. The secondary inorganic species such as nitrates (from precursors emitted by vehicles, district heating, and industrial facilities) and sulphates (often from precursor gases emitted by coal-based combustion sources located nearby or far away) are mainly accumulated in both PM1 and PM2.5. But the PM1 fraction is likely a better indicator of primary combustion emissions than the PM1–2.5 fraction. Vehicle exhaust emissions from fossil fuel combustion also tend to show loadings in PM1, whereas non-exhaust emissions, such as brake and tyre wear, generate particles across both fine (PM2.5) and coarse (PM2.5-10) size ranges, with a greater proportion of their mass generally occurring in the coarse fraction. Similarly, combustion-related sources such as biomass burning, waste burning, and incineration contribute more to PM1, while larger particles generated from mechanical processes and crustal sources contribute more to PM2.5 and PM10. While detailed source apportionment requires chemical characterisation of PM or the use of emission inventories combined with modelling, size-resolved measurements including PM1 provide a crucial first indication of dominant PM sources.
Environmental dust monitors (EDMs) enable real-time measurement of multiple particle-size fractions within a single setup, rather than relying on three separate instruments for each size fraction. These instruments can simultaneously measure PM1, PM2.5, PM10, and total suspended PM; derive mass concentrations for other size cuts; and provide the full particle-size distribution.
Two such systems (EDM 280), one each in Kolkata and Bengaluru, have been deployed by the Center for Study of Science, Technology and Policy (CSTEP). Comparisons with reference-grade beta attenuation monitors show satisfactory agreement for both PM2.5 (slope 0.79, coefficient of determination [R²] = 0.75) and PM10 (slope 0.71, R² = 0.78) in Bengaluru, demonstrating the instrument’s reliability for urban air quality monitoring.
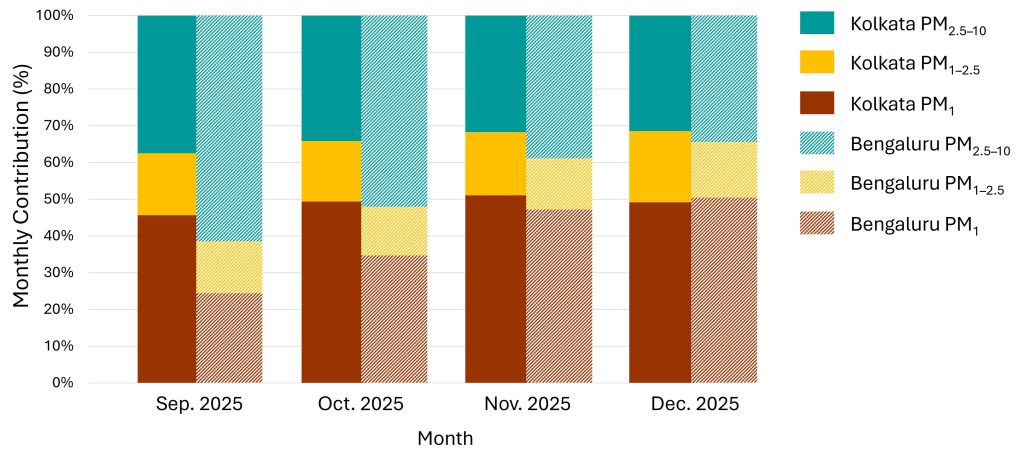
In Bengaluru and Kolkata, EDMs have been in operation since September 2025, and this analysis focuses on data collected between September and December 2025. The monthly percentage contribution of each size fraction (PM1, PM1–2.5, and PM2.5–10) shows significant variation for Bengaluru but only slight variation for Kolkata.
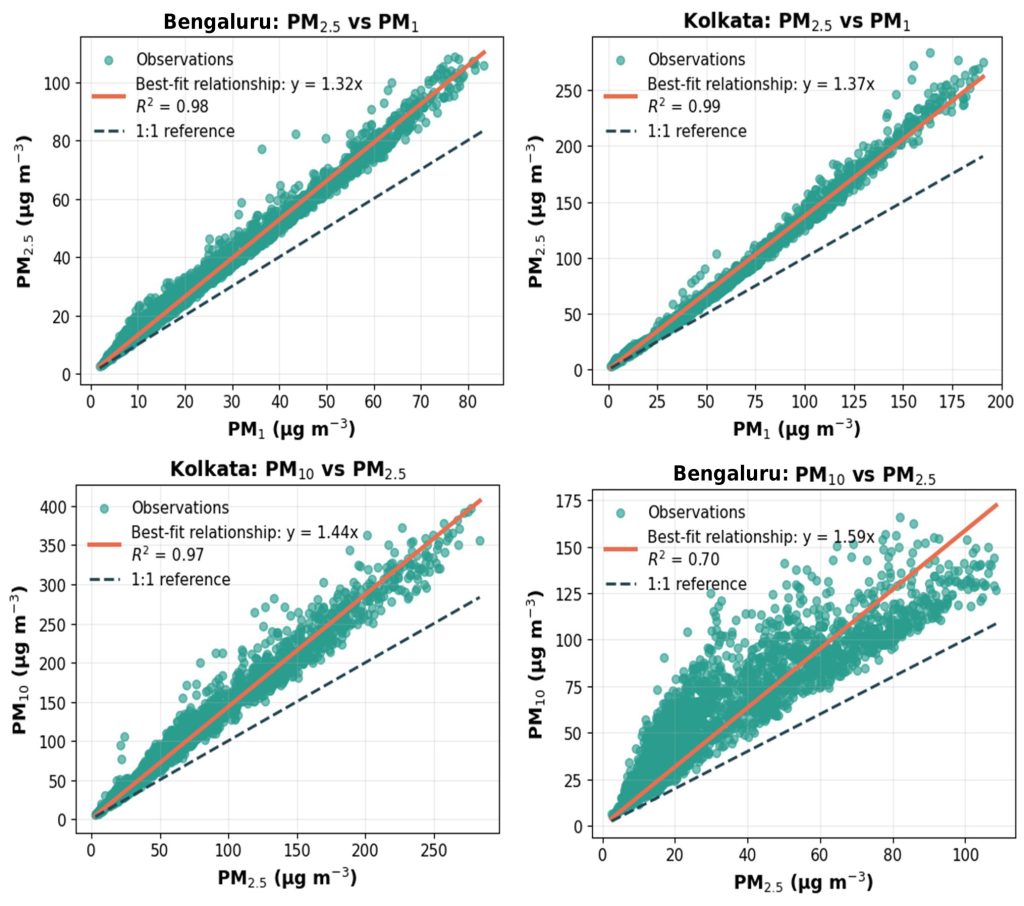
In both cities, PM1 shows a strong linear relationship with PM2.5 (R² = 0.99 for both Kolkata and Bengaluru). A higher R² indicates that a large fraction of the variability in PM₂.₅ is explained by PM₁. While this does not directly identify the sources, PM₁ is typically dominated by combustion, secondary organic and inorganic aerosols, and regionally transported aerosols. Therefore, it can be inferred that both PM₁ and PM₂.₅ in Kolkata are largely influenced by combustion sources and long-range transport. In contrast, the relationship between PM2.5 and PM10 differs markedly between the two cities (R² = 0.99 and R² = 0.70 for Kolkata and Bengaluru, respectively). In Kolkata, PM2.5 and PM10 vary linearly, with data closely following the best-fit regression line, suggesting common sources for fine and coarse fractions. In Bengaluru, however, the PM2.5–PM10 relationship does not exhibit a clear linear trend over the four months, with substantial scatter around the slope line, reflecting a stronger and more variable contribution from coarse particles. These findings provide critical insights into the respective seasonal contribution and variation in sources (regional, local, mechanical, combustion, etc.).
The monthly percentage relative contribution plot shows that PM1 consistently dominates PM10, indicating that most PM10 mass in Kolkata is submicron and primarily associated with regional and combustion-related sources. On the other hand, in Bengaluru, PM1 accounts for a smaller fraction of PM10 between September and mid-October, after which the contribution stabilises at around 50% between November and December. This highlights a clear seasonal transition in dominant sources, demonstrating the capability of simultaneous size-resolved measurements in capturing changes in pollution sources.
Such measurement results, as provided above, could enable policymakers to take city-specific, evidence-based actions during pollution episodes by identifying the sources that contribute most to the pollution load. As the PM1 fraction dominates the PM10 fraction in Kolkata, it is essential to reduce PM1 to obtain the targeted reduction in PM10 under the National Clean Air Programme (NCAP). In Bengaluru, a season-specific approach may be more effective, as the share of PM1 within PM10 is observed to vary month-wise, largely driven by seasonal changes.
Further, such size-resolved PM measurements can be employed to obtain actionable insights into dominant types of emission sources, in lieu of a detailed chemical characterisation that enables source apportionment. Globally, there is a growing recognition of the importance of monitoring the smaller size fractions alongside PM2.5 and PM10, as reflected in the European Union Air Quality Directive 2024. Integrating PM₁ into routine monitoring and air quality guidelines would enable more targeted, city-specific mitigation strategies and improve the effectiveness of clean air action plans in India.
Acknowledgement: We sincerely thank Dr R Subramanian and Dr Prakash Doraiswamy for their valuable insights as reviewers during the preparation and analysis of the blog.
Umer Ali, PhD, Former Senior Associate in the Air Quality Observations team at CSTEP, also co-authored the article.

In this blog series titled Measuring the Microns, we examine why greater...

India’s transition to a cleaner power system has moved from a supply...

In the first blog in ‘The AI shift’ series, we examined what...

With growing electricity demand, renewable energy penetration, and storage requirements, Indian distribution...

In the first blog in ‘The AI shift’ series, we looked into...

Following our photo essay from the field, this blog looks at the...